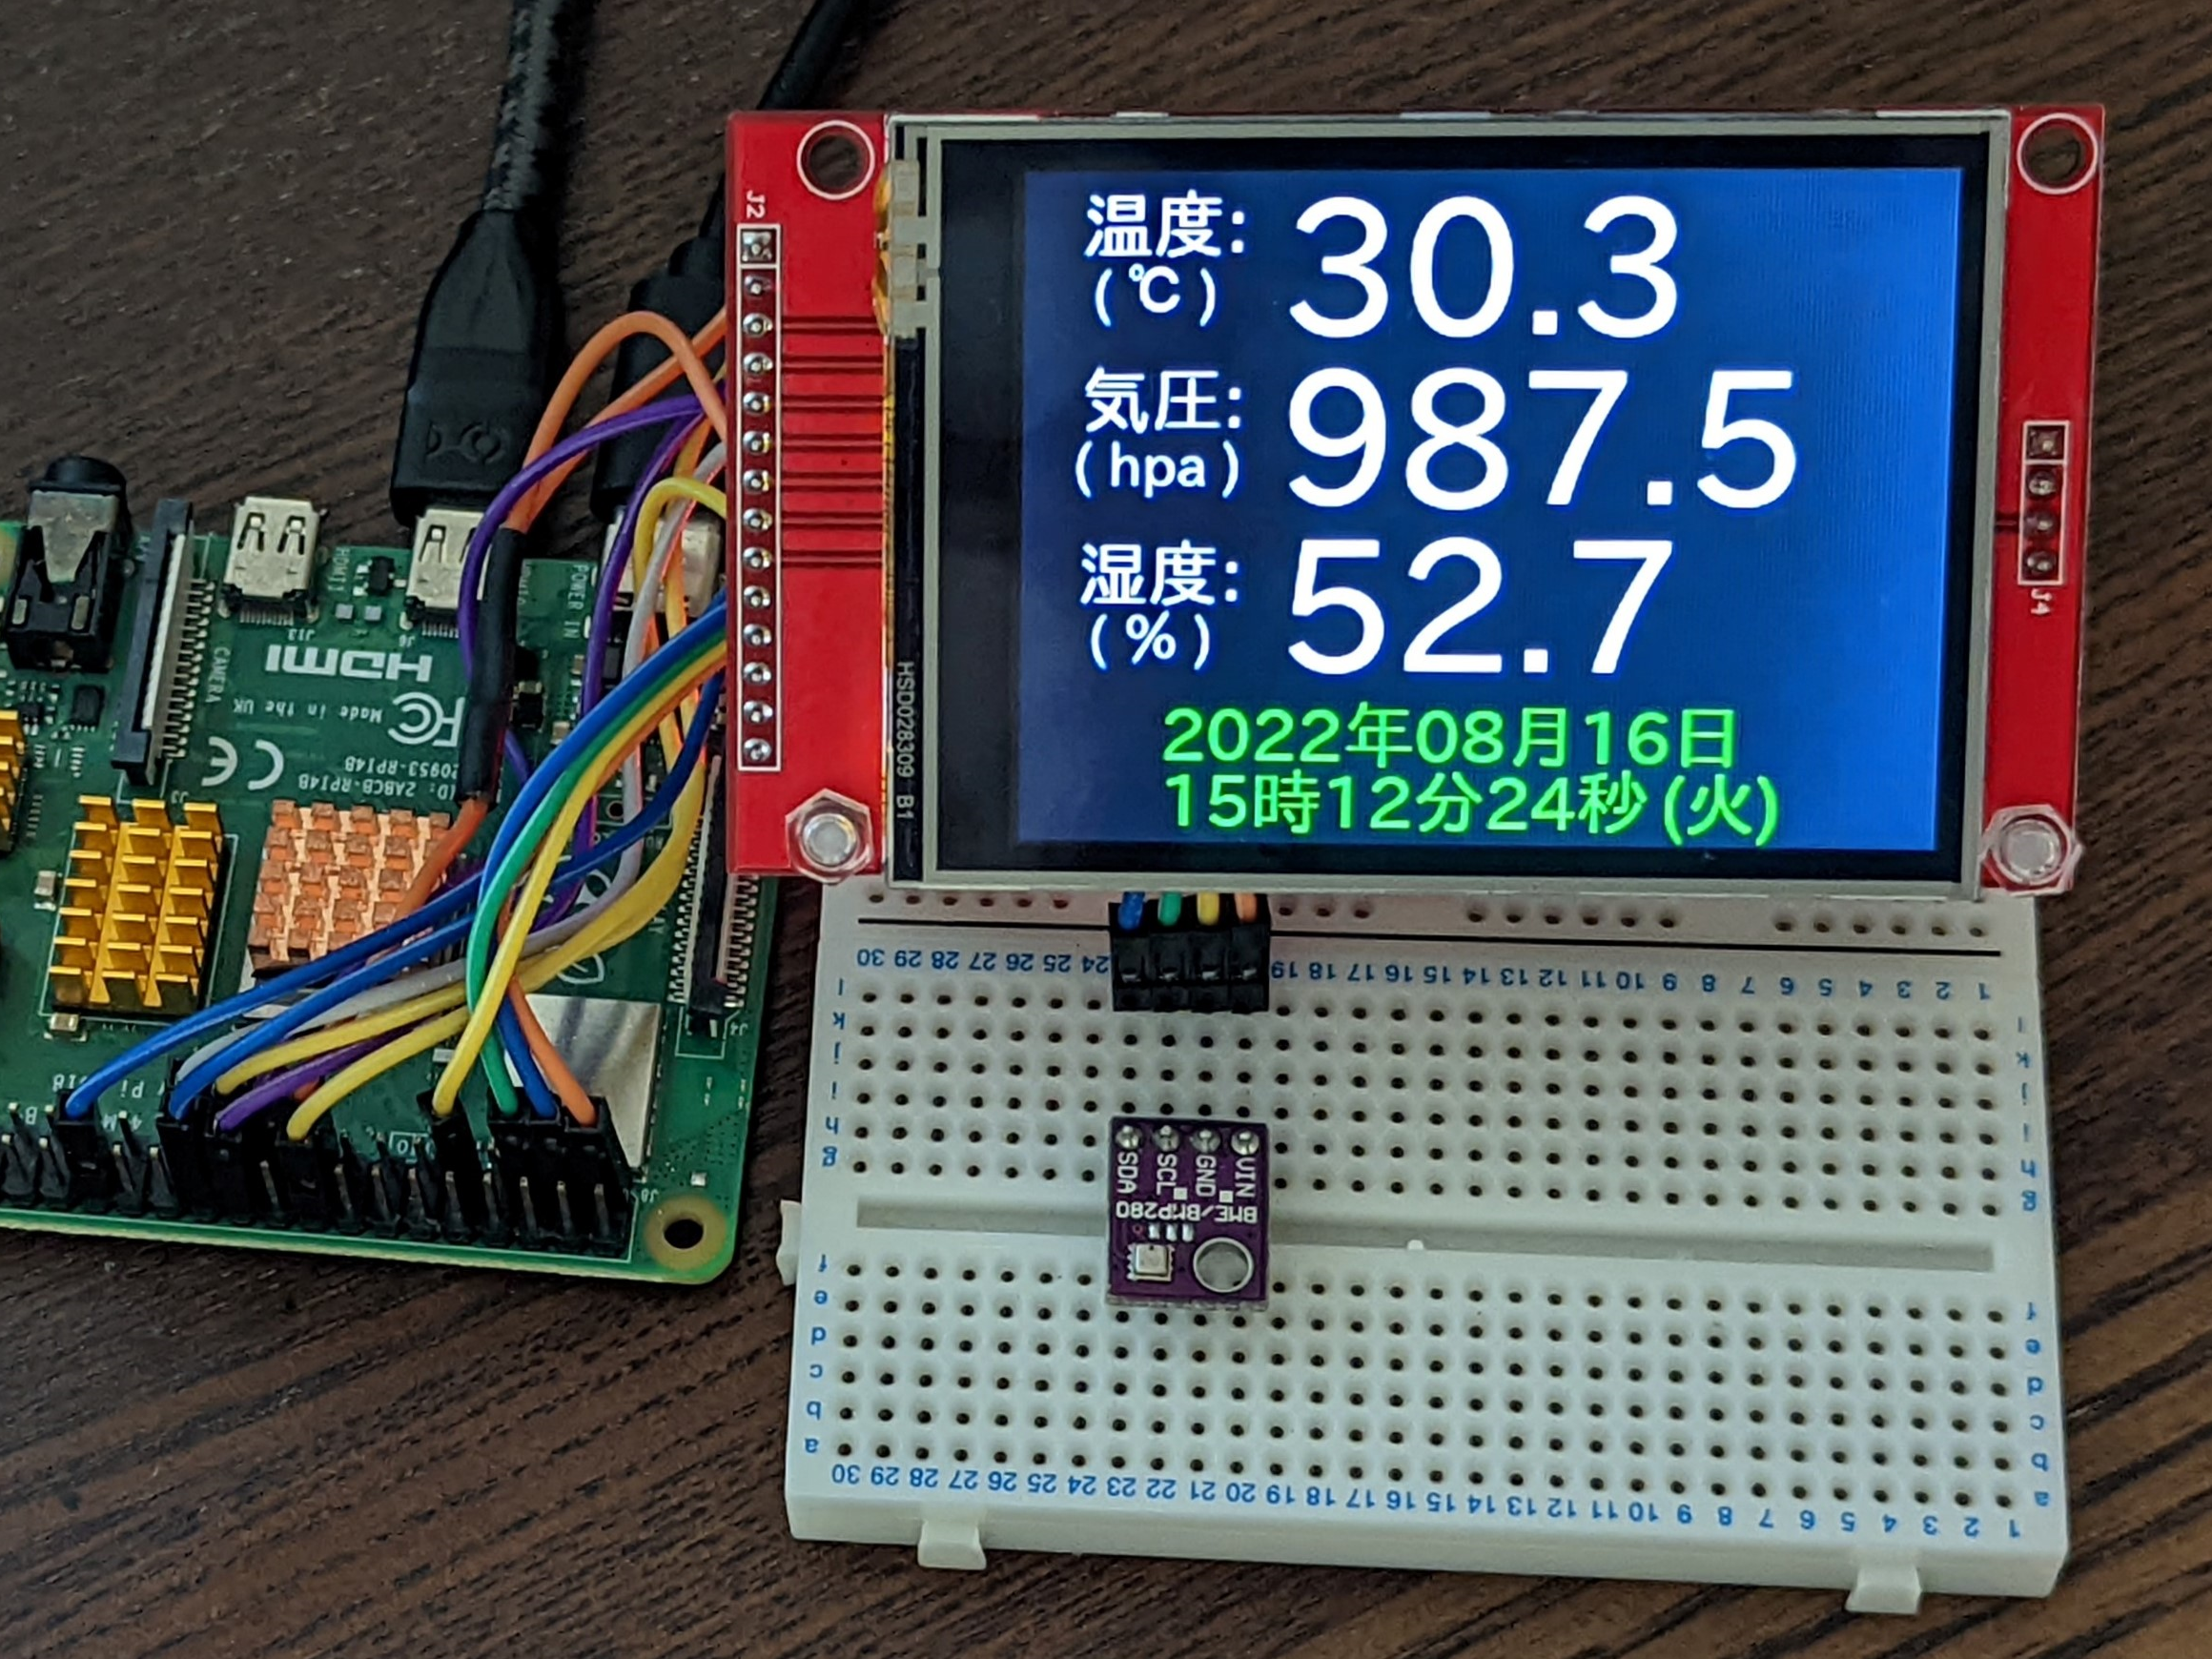
Raspberry Pi 4B(以下4B)とBME280センサモジュールの測定データをSPI接続した2.8インチTFT液晶 (240×320、ILI9341)モジュールに日本語フォントで表示した際の作業メモです。
Raspberry Pi OS(bullseye)ではソフトウエアupdate通知アイコンがタスクバーに表示されるので作業前に更新しておきます。
パーツの結線とRaspberry Pi OSのI2C、SPIの有効化
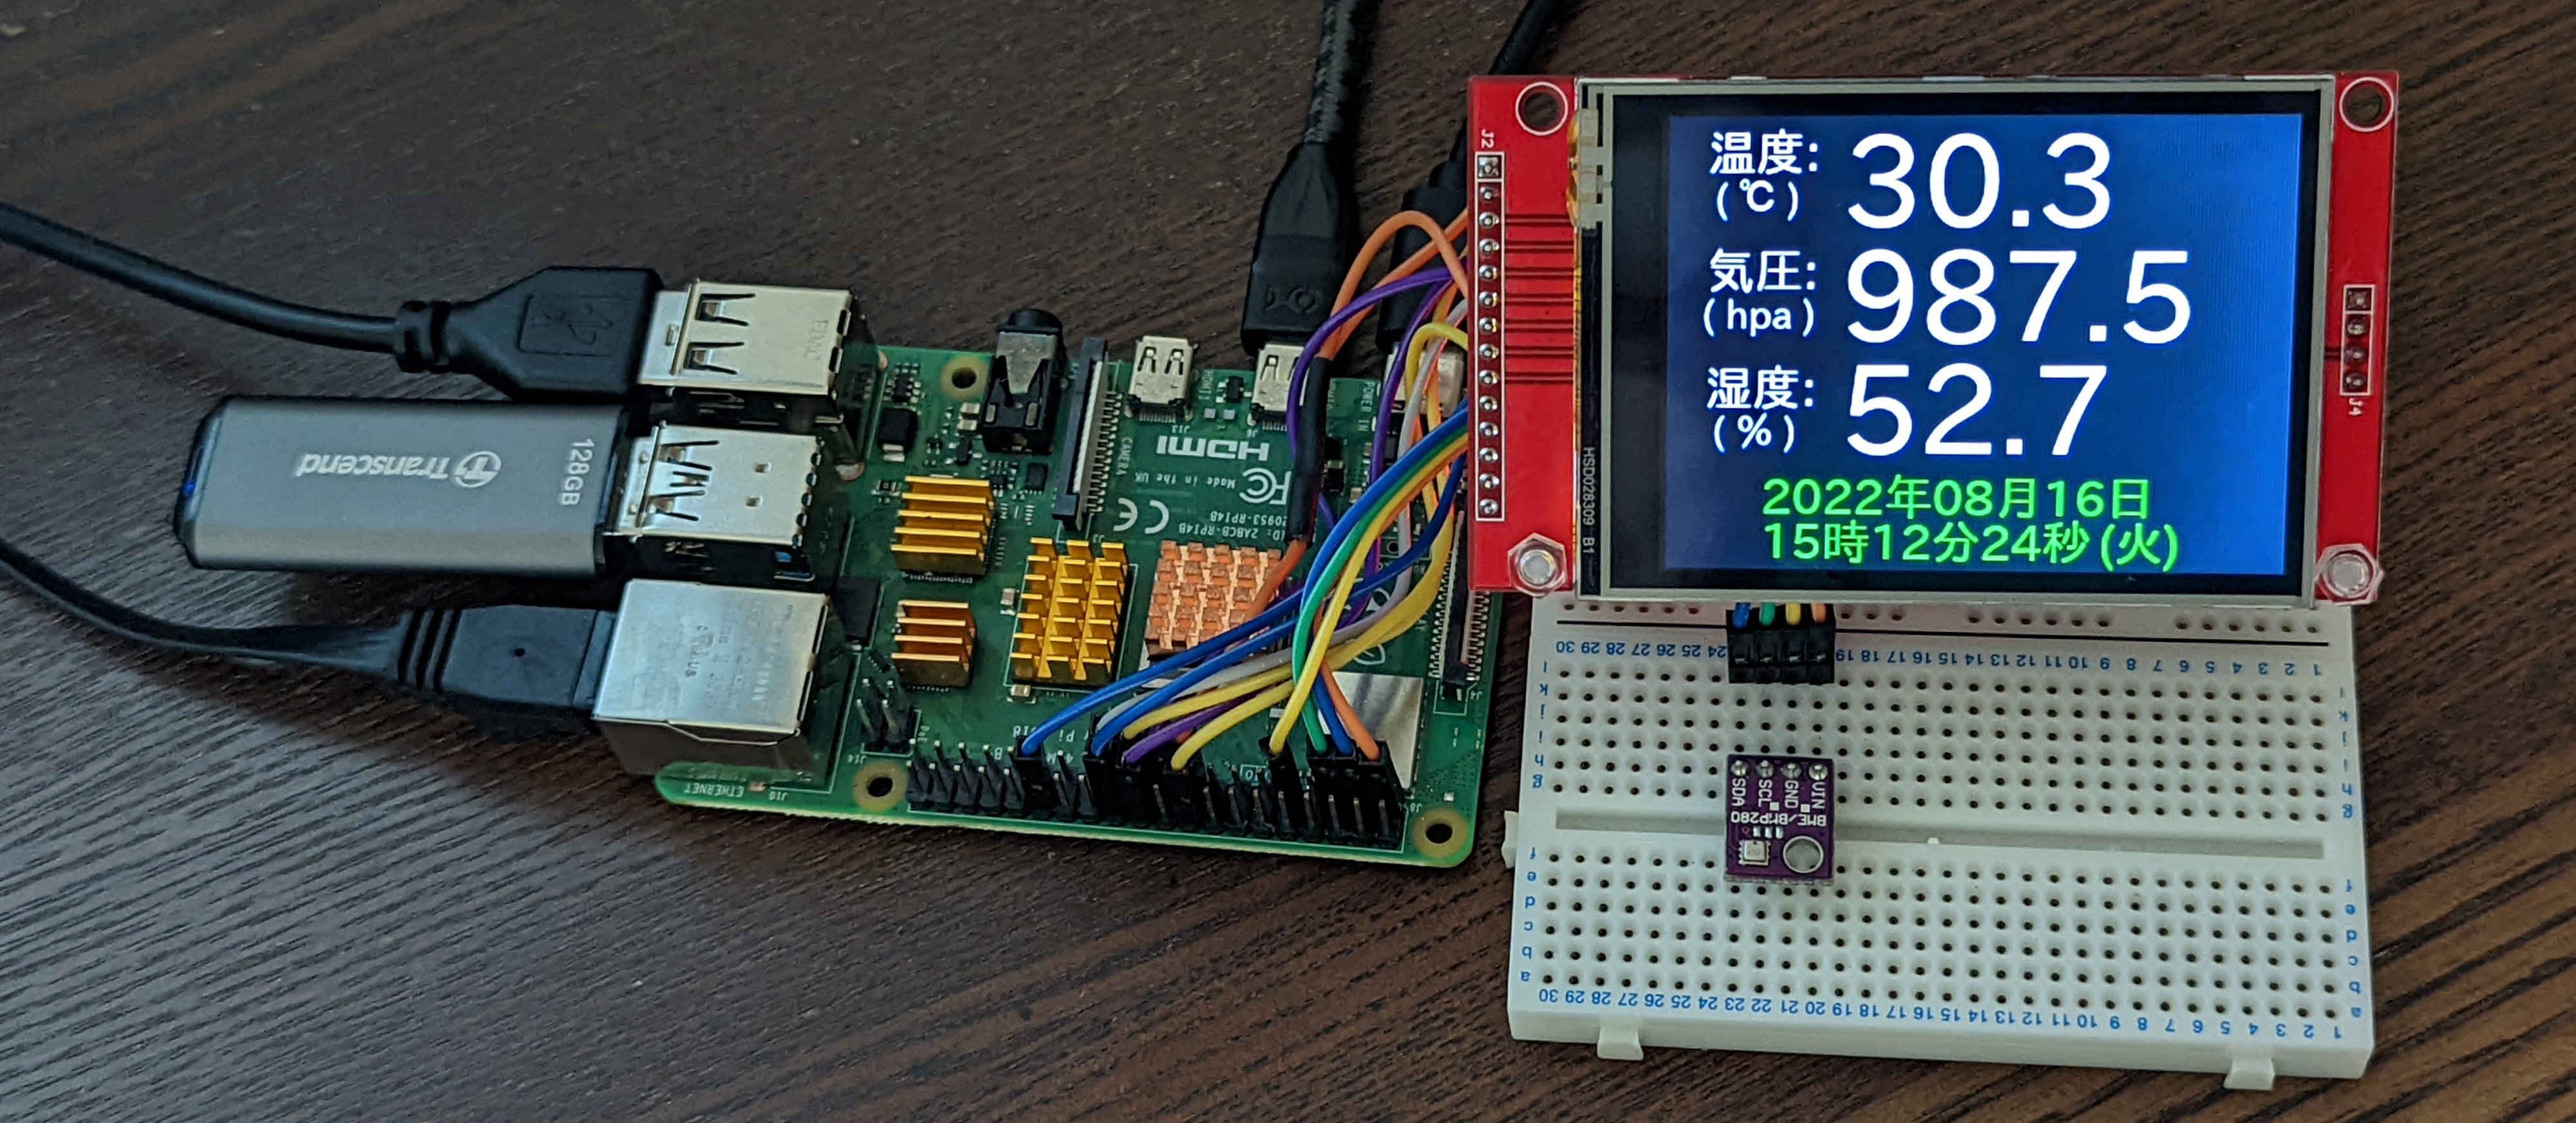
BME280センサで気圧、気温、湿度を測定して2.8インチTFT液晶 (240×320)モジュールに日本語フォントで表示します。
結線図
2.8インチTFT液晶 (240×320)モジュールをSPIで、BME280センサモジュールをSoC内蔵の I2C(ハードウエア I2C)で接続する結線図です。2.8インチTFT液晶 (240×320)液晶モジュールは4線式のSPIです。
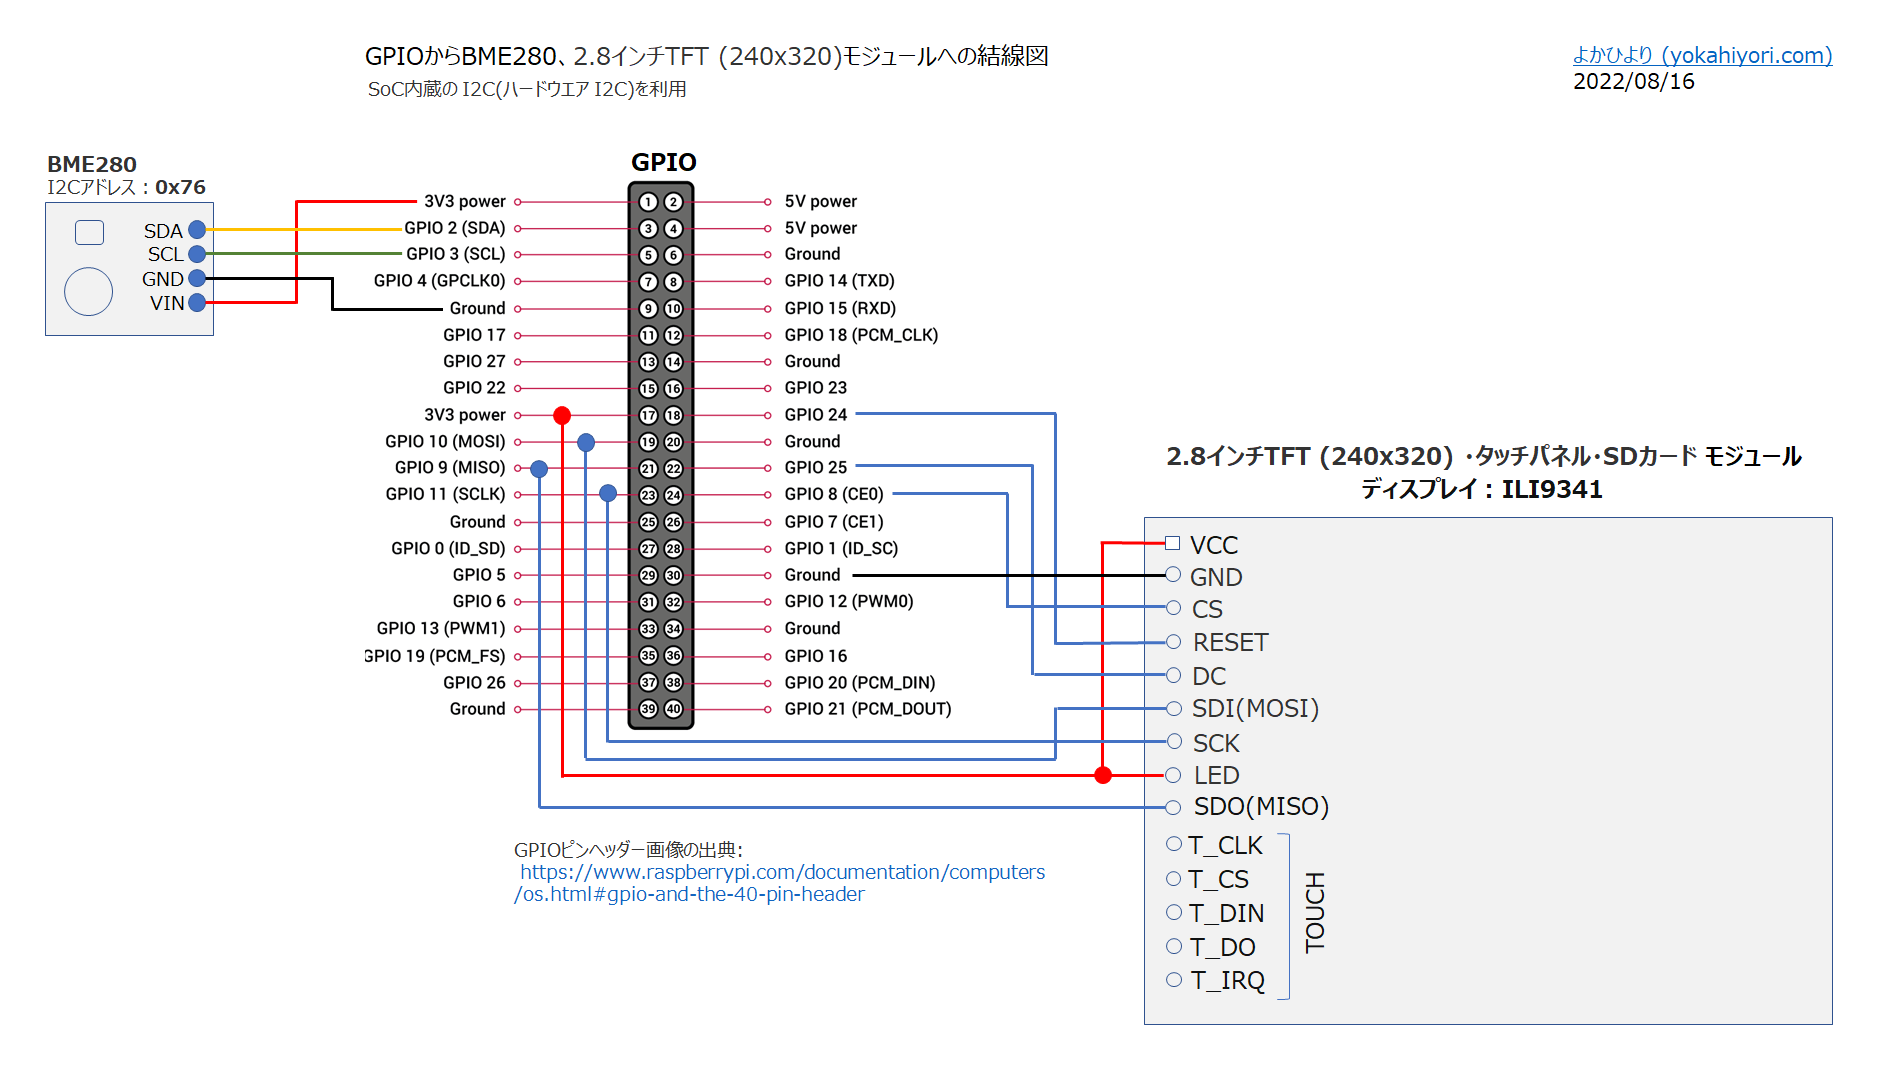
2.8インチTFT液晶モジュールとGPIOとのピン接続の詳細は下記ページに纏めました。本記事ではライブラリのインストールなど必要事項のみの記載です。
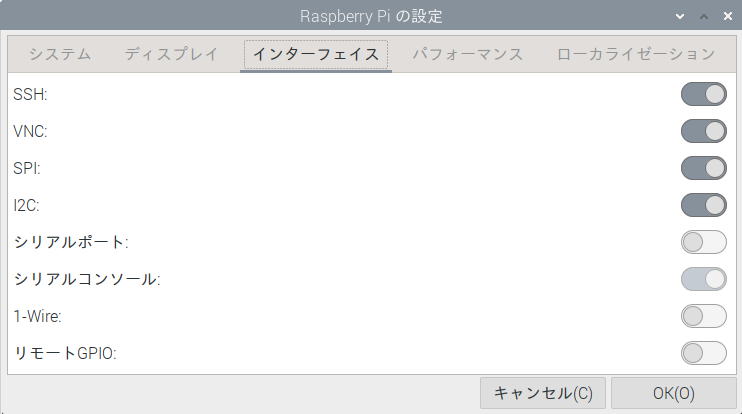
Raspberry Pi OSのI2CとSPIを有効化
I2CとSPIの設定 はデフォルトでは無効です。
苺メニューの「設定」–>「Raspberry Piの設定」を開いて–>「インターフェース」でI2CとSPIを有効にチェック。再起動するとSoC内蔵の I2C(ハードウエア I2C とSPI通信が使えるようになります。
LXTerminalで下記コマンドを投入すると、i2c-1(バス番号1)にBME280のアドレス(0x76)が見えます。
ls /dev/i2c*
i2cdetect -l
i2cdetect -y 1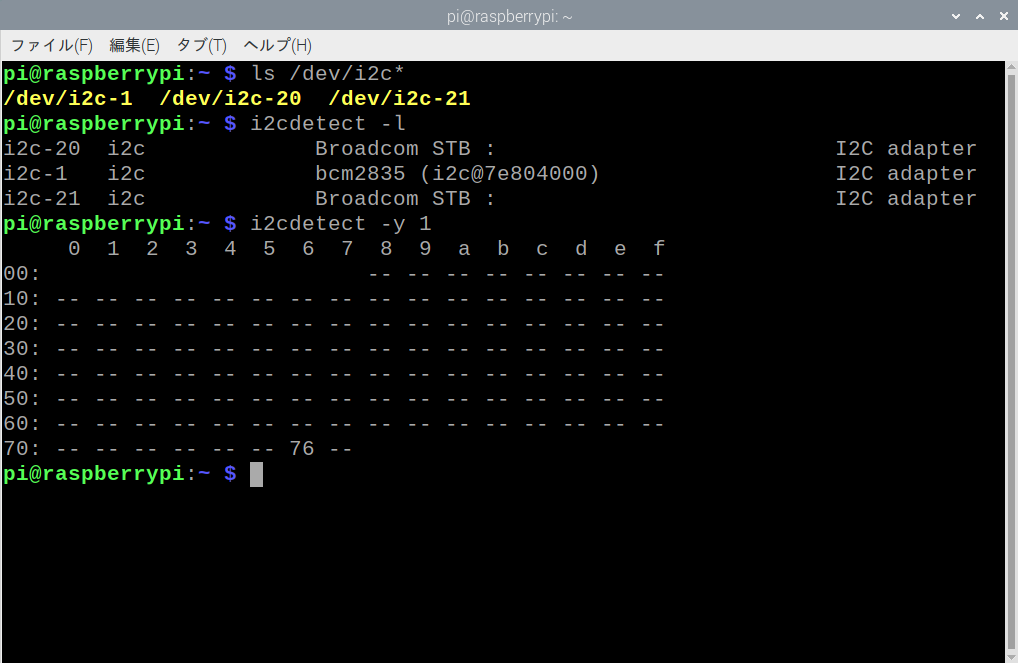
Python3:ライブラリのインストール
ライブラリのインストールにはpipを使います。pipは、Pythonパッケージのインストールなどを行うユーティリティで、Raspberry Pi OS with desktop(bullseye)にはPython3とともにインストールされています。
バージョンはPythonが3.9.2、pipが20.3.4。
構築したRaspberry Pi OSにはPython3のみなので、コマンドではpipとpip3を区別していません。
smbus2
未インストールであればi2C通信を行うためにsmbus2をインストールします。smbus2パッケージは「smbus2-0.3.0」でした。
sudo pip install smbus22.8インチTFT液晶ライブラリ
2.8インチTFT液晶 (240×320)モジュールの液晶コントローラLSIはILI9341。Adafruitのライブラリ「Adafruit_CircuitPython_RGB_Display」を利用させていただきました。
sudo pip install adafruit-circuitpython-rgb-displayhttps://github.com/adafruit/Adafruit_CircuitPython_RGB_Display
BME280ライブラリ
BME280のライブラリには「RPi.bme280 0.2.4」を利用させていただきました。Python3コード上でI2Cアドレスとポート番号を指定できるで使い勝手が良いです。
sudo pip install RPi.bme280https://pypi.org/project/RPi.bme280/
Python3:BME280測定データを2.8インチTFT液晶に表示
「RPi.bme280 0.2.4」サイト掲載のサンプルコードを参考に出力先として2.8インチTFT液晶モジュールを加えた「bme280_sample_TFT_csv.py」を作りました。
日本語を表示するために、独立行政法人情報処理推進機構 (IPA) が提供している日本語フォント「IPAex フォント」をインストール。「ipaexfont-gothic」を使っています。
sudo apt install fonts-ipaexfontRaspberry Pi OS with desktop(bullseye)にプリインストール されているThonny Python IDEを使って動作確認しました。
Thonny Python IDEのshell部分にCSV形式で連続表示するとともに、2.8インチTFT液晶モジュールにも日時(曜日)、気圧、気温、湿度を2秒間隔で表示します。
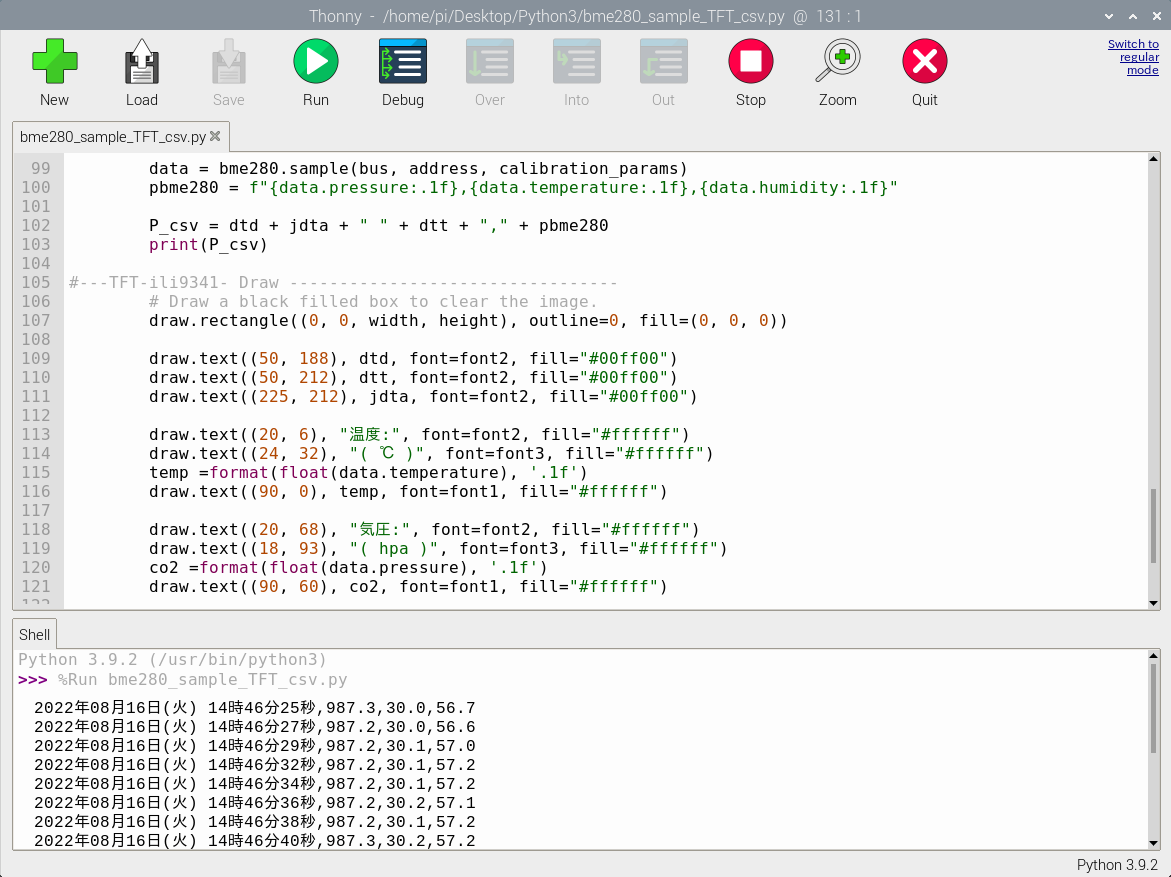
Thonny Python IDEのshell部分へのCSV表示が不要な場合は103行目を#でコメントアウトします。
bme280_sample_TFT_csv.py
※ここをクリックするとコード表示を開閉できます。
#bme280_sample_TFT_csv.py
#coding: utf-8

#---TFT-ili9341 init-----rgb_display_pillow_stats.py---
import time
import subprocess
import digitalio
import board
from PIL import Image, ImageDraw, ImageFont
from adafruit_rgb_display import ili9341

# Configuration for CS and DC pins (these are PiTFT defaults):
cs_pin = digitalio.DigitalInOut(board.CE0)
dc_pin = digitalio.DigitalInOut(board.D25)
reset_pin = digitalio.DigitalInOut(board.D24)

# Config for display baudrate (default max is 24mhz):
BAUDRATE = 24000000

# Setup SPI bus using hardware SPI:
spi = board.SPI()

# pylint: disable=line-too-long
# Create the display:
disp = ili9341.ILI9341(
    spi,
    rotation=90,  # 2.2", 2.4", 2.8", 3.2" ILI9341
    cs=cs_pin,
    dc=dc_pin,
    rst=reset_pin,
    baudrate=BAUDRATE,
)
# pylint: enable=line-too-long
# Create blank image for drawing.
# Make sure to create image with mode 'RGB' for full color.
if disp.rotation % 180 == 90:
    height = disp.width  # we swap height/width to rotate it to landscape!
    width = disp.height
else:
    width = disp.width  # we swap height/width to rotate it to landscape!
    height = disp.height

image = Image.new("RGB", (width, height))

# Get drawing object to draw on image.
draw = ImageDraw.Draw(image)

# Draw a black filled box to clear the image.
draw.rectangle((0, 0, width, height), outline=0, fill=(0, 0, 0))
disp.image(image)

# First define some constants to allow easy positioning of text.
padding = -2
x = 0

# Load a ipaexfont-gothic font.
font1 = ImageFont.truetype("/usr/share/fonts/opentype/ipaexfont-gothic/ipaexg.ttf", 65)
font2 = ImageFont.truetype("/usr/share/fonts/opentype/ipaexfont-gothic/ipaexg.ttf", 25)
font3 = ImageFont.truetype("/usr/share/fonts/opentype/ipaexfont-gothic/ipaexg.ttf", 20)


#---BME280 init---------------bme280_sample.py------------
import smbus2
import bme280

port = 1
address = 0x76
bus = smbus2.SMBus(port)

calibration_params = bme280.load_calibration_params(bus, address)

# the sample method will take a single reading and return a
# compensated_reading object
data = bme280.sample(bus, address, calibration_params)


while True:
#---csv out  ------------------------------------------
        dtd = time.strftime('%Y年%m月%d日', time.localtime())
        dtt = time.strftime('%H時%M分%S秒', time.localtime())
        dta = time.strftime('%a', time.localtime())
        if dta == "Mon":
           jdta = dta.replace("Mon", "(月)")
        elif dta == "Tue":
           jdta = dta.replace("Tue", "(火)")
        elif dta == "Wed":
           jdta = dta.replace("Wed", "(水)")
        elif dta == "Thu":
           jdta = dta.replace("Thu", "(木)")
        elif dta == "Fri":
           jdta = dta.replace("Fri", "(金)")
        elif dta == "Sat":
           jdta = dta.replace("Sat", "(土)")
        elif dta == "Sun":
           jdta = dta.replace("Sun", "(日)")
        else:
           jdta="ー"

        data = bme280.sample(bus, address, calibration_params)
        pbme280 = f"{data.pressure:.1f},{data.temperature:.1f},{data.humidity:.1f}"

        P_csv = dtd + jdta + " " + dtt + "," + pbme280
        print(P_csv)

#---TFT-ili9341- Draw ---------------------------------
        # Draw a black filled box to clear the image.
        draw.rectangle((0, 0, width, height), outline=0, fill=(0, 0, 0))

        draw.text((50, 188), dtd, font=font2, fill="#00ff00")
        draw.text((50, 212), dtt, font=font2, fill="#00ff00")
        draw.text((225, 212), jdta, font=font2, fill="#00ff00")

        draw.text((20, 6), "温度:", font=font2, fill="#ffffff")
        draw.text((24, 32), "( ℃ )", font=font3, fill="#ffffff")
        temp =format(float(data.temperature), '.1f')
        draw.text((90, 0), temp, font=font1, fill="#ffffff")

        draw.text((20, 68), "気圧:", font=font2, fill="#ffffff")
        draw.text((18, 93), "( hpa )", font=font3, fill="#ffffff")
        co2 =format(float(data.pressure), '.1f')
        draw.text((90, 60), co2, font=font1, fill="#ffffff")

        draw.text((20, 130), "湿度:", font=font2, fill="#ffffff")
        draw.text((24, 155), "( % )", font=font3, fill="#ffffff")
        humi =format(float(data.humidity), '.1f')
        draw.text((90, 120), humi, font=font1, fill="#ffffff")

        disp.image(image)

        time.sleep(2)