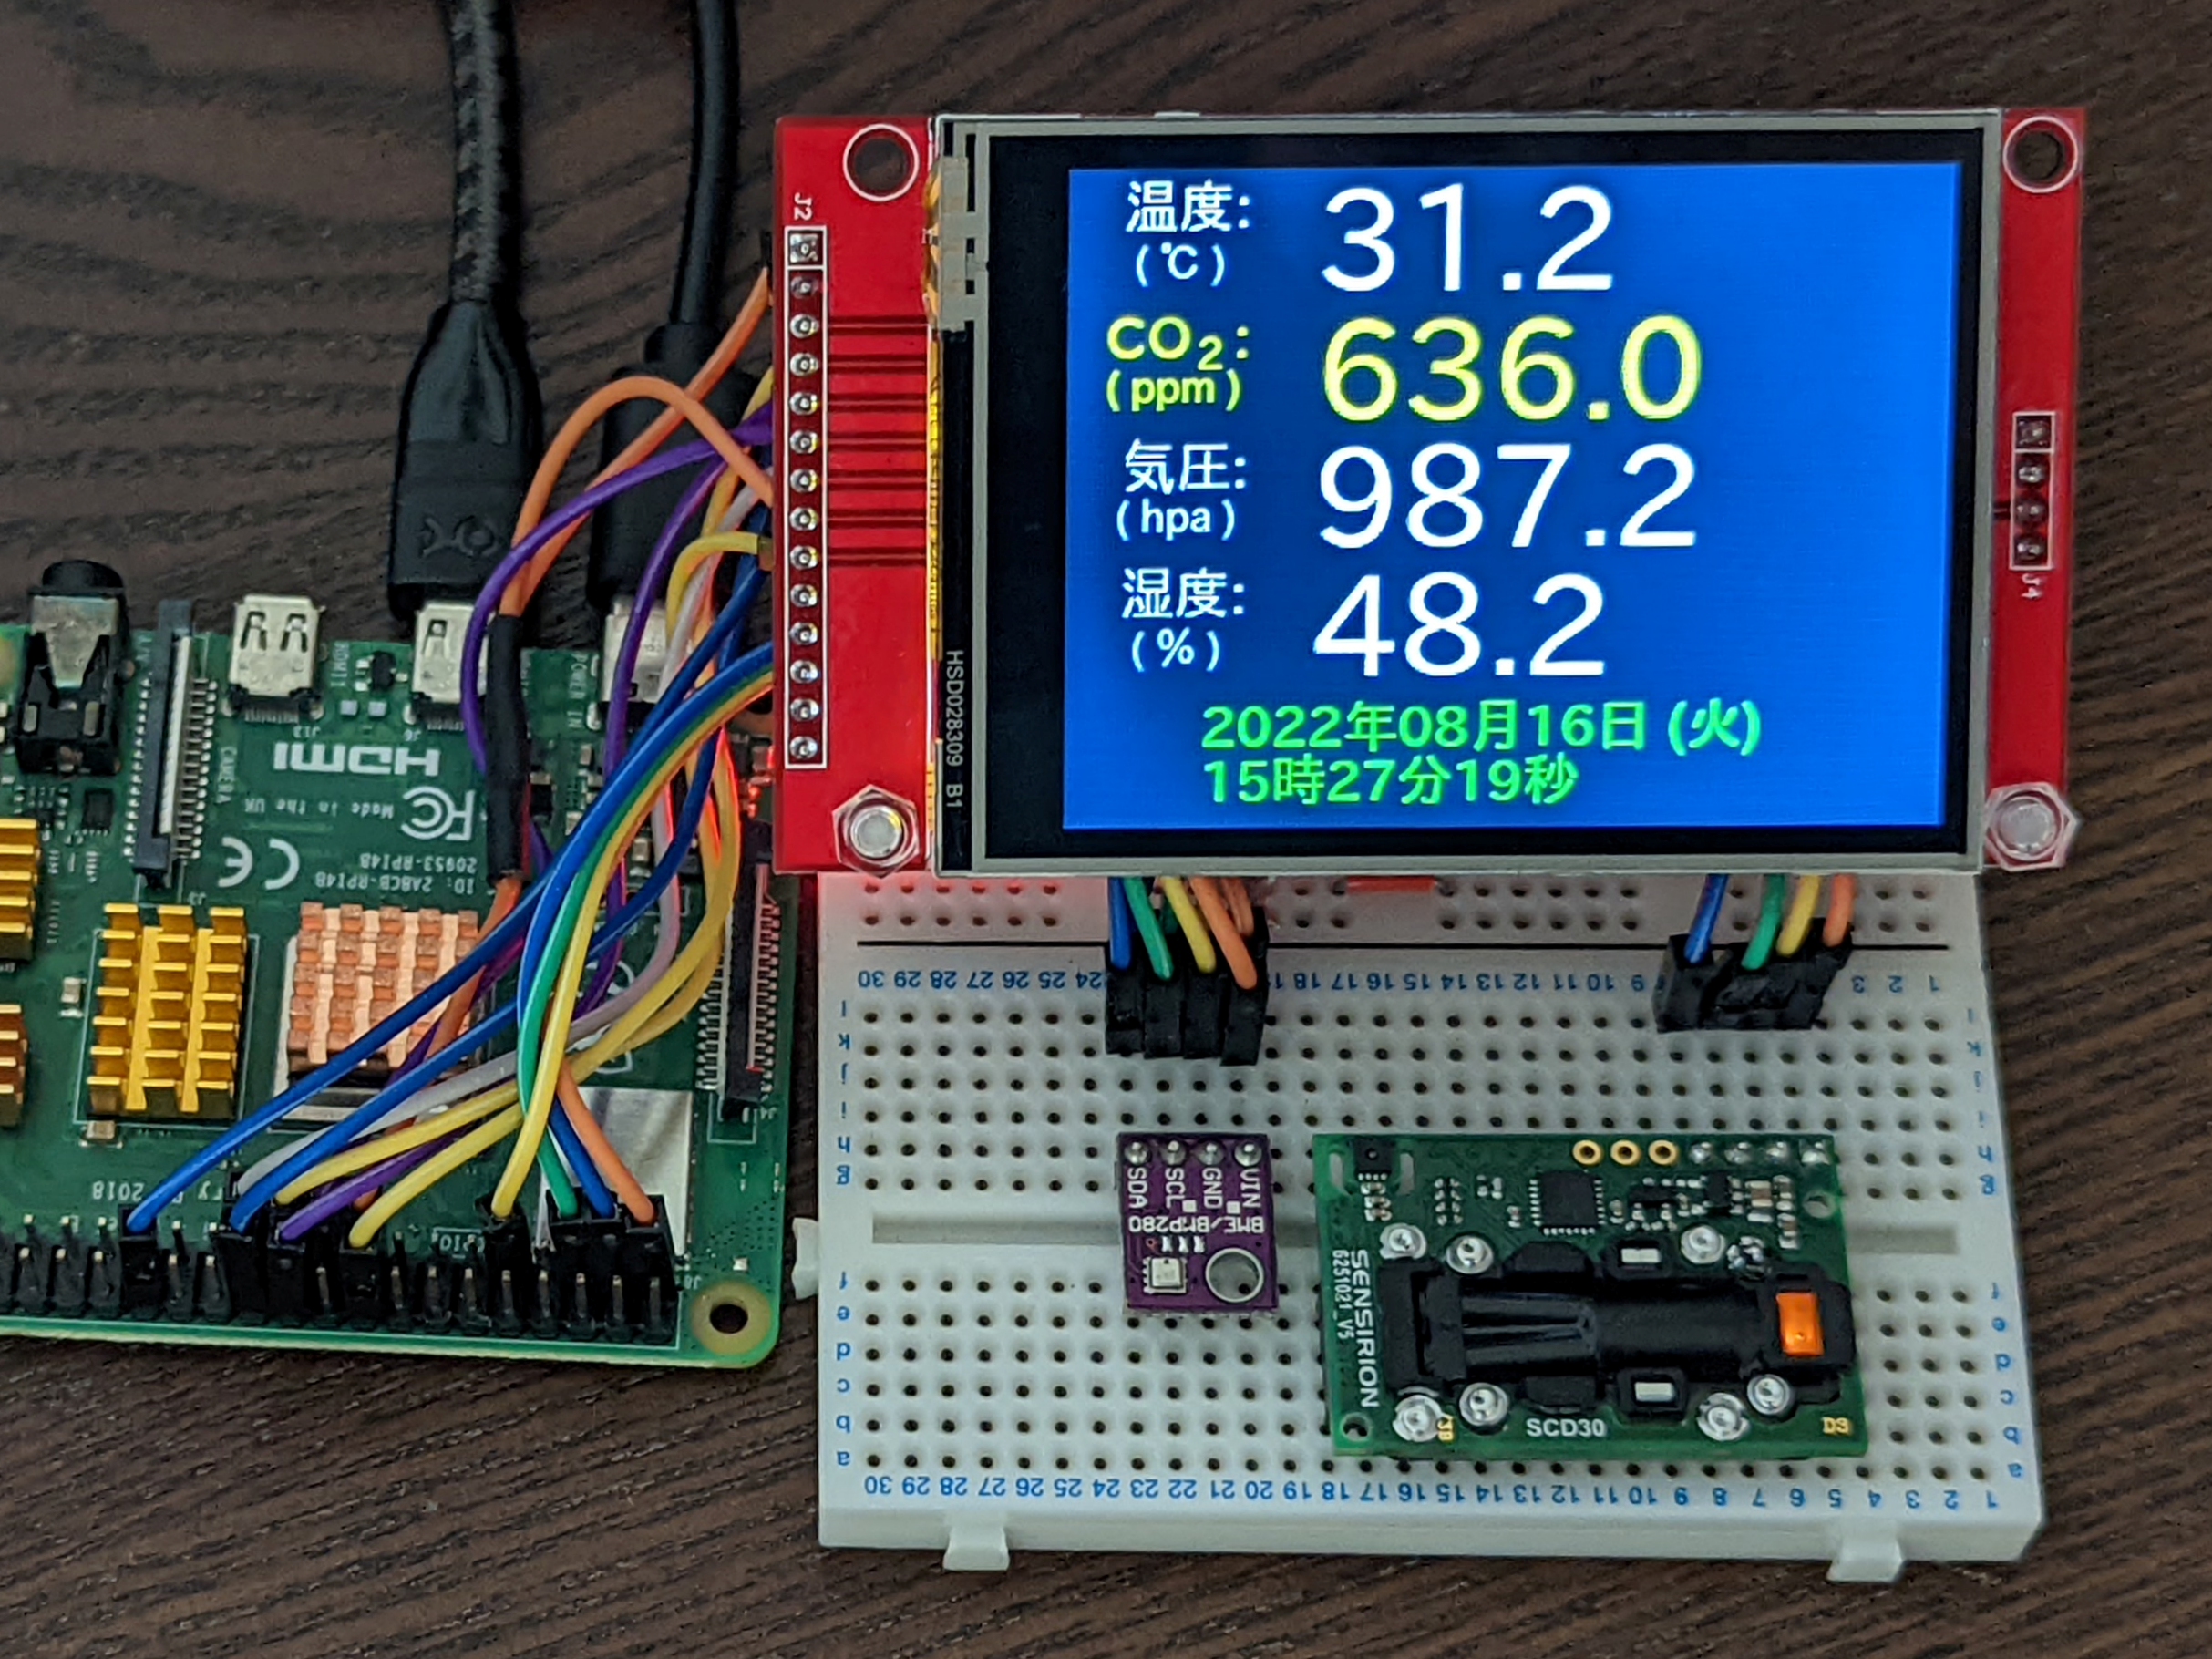
Raspberry Pi 4B(以下4B)とSCD30センサとBME280センサモジュールの測定データをSPI接続した2.8インチTFT液晶(240×320、ILI9341)モジュールに日本語フォントで表示した際の作業メモです。
Raspberry Pi OS(bullseye)ではソフトウエアupdate通知アイコンがタスクバーに表示されるので作業前に更新しておきます。
パーツの結線とRaspberry Pi OSのI2C、SPIの有効化
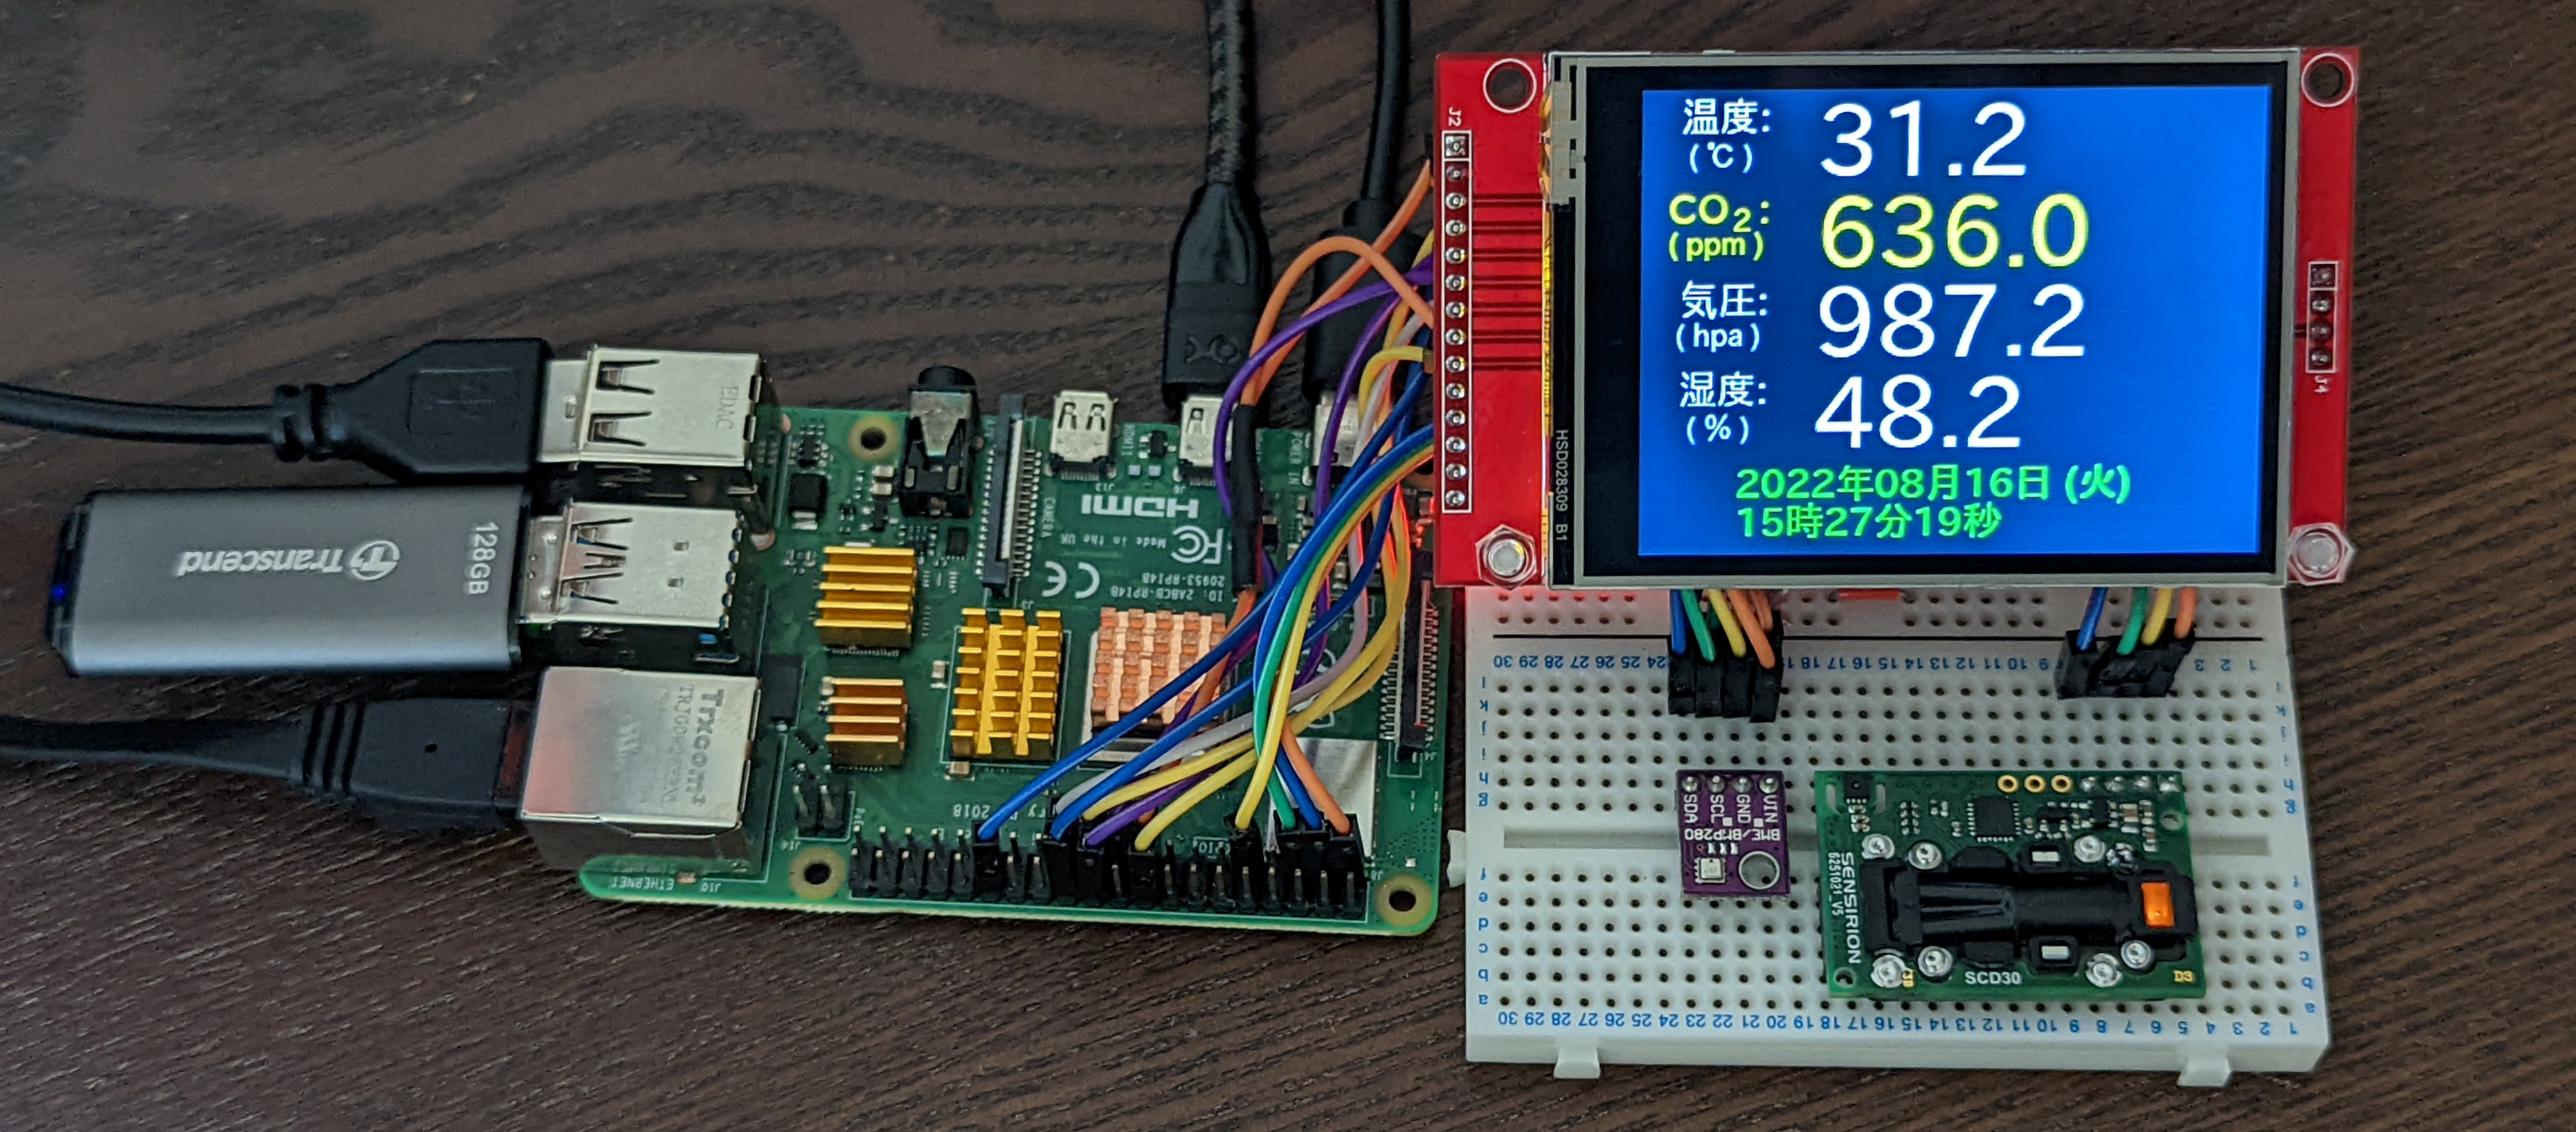
SCD30センサでCO2濃度、BME280センサで気圧、気温、湿度を測定して2.8インチTFT液晶 (240×320)モジュールに日本語フォントで表示します。
結線図
2.8インチTFT液晶(240×320)モジュールをSPIで、SCD30センサとBME280センサモジュールをSoC内蔵の I2C(ハードウエア I2C)で接続する結線図です。2.8インチTFT液晶(240×320)液晶モジュールは4線式のSPIです。

2.8インチTFT液晶モジュールとGPIOとのピン接続の詳細は下記ページに纏めました。本記事ではライブラリのインストールなど必要事項のみの記載です。
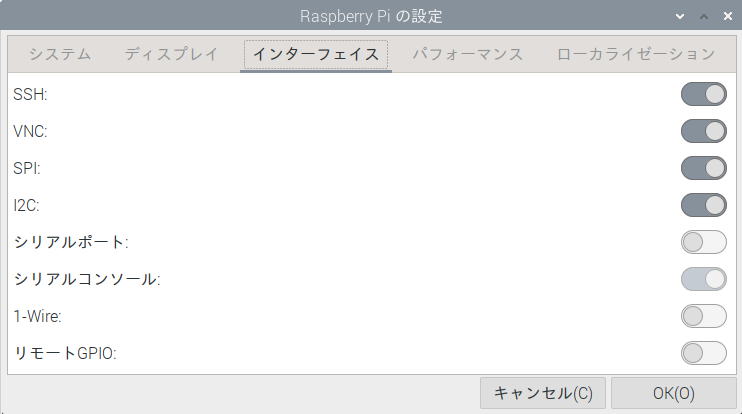
Raspberry Pi OSのI2CとSPIを有効化
I2CとSPIの設定 はデフォルトでは無効です。
苺メニューの「設定」–>「Raspberry Piの設定」を開いて–>「インターフェース」でI2CとSPIを有効にチェック。再起動するとSoC内蔵の I2C(ハードウエア I2C とSPI通信が使えるようになります。
LXTerminalで下記コマンドを投入すると、i2c-1(バス番号1)にBME280のアドレス(0x76)とSCD30のアドレス(0x61)が見えます。
ls /dev/i2c*
i2cdetect -l
i2cdetect -y 1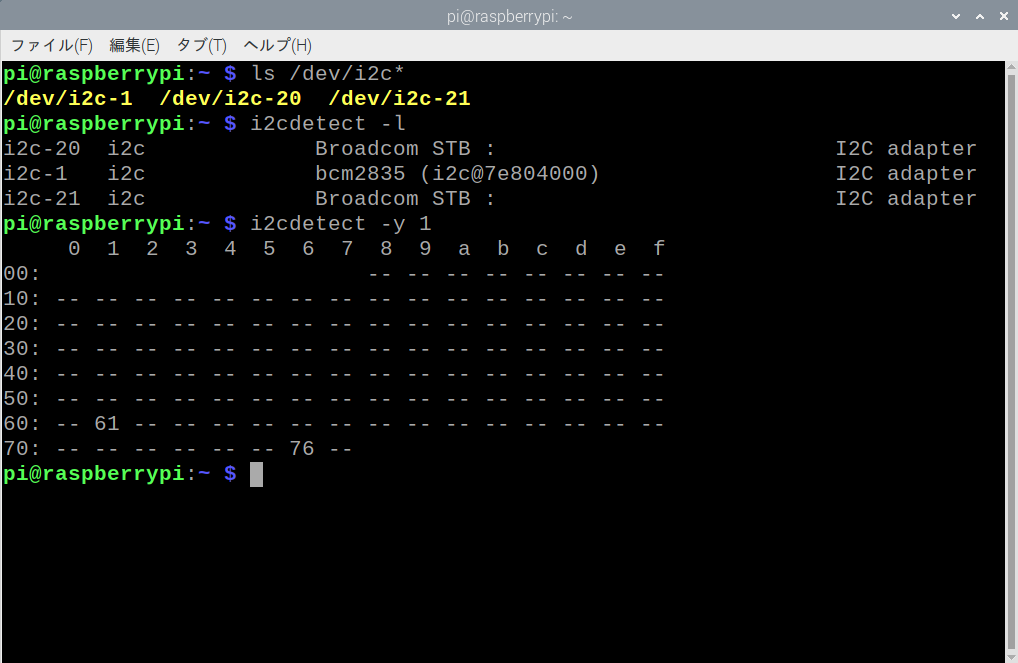
Python3:ライブラリのインストール
ライブラリのインストールにはpipを使います。pipは、Pythonパッケージのインストールなどを行うユーティリティで、Raspberry Pi OS with desktop(bullseye)にはPython3とともにインストールされています。
バージョンはPythonが3.9.2、pipが20.3.4。
構築したRaspberry Pi OSにはPython3のみなので、コマンドではpipとpip3を区別していません。
smbus2
未インストールであればi2C通信を行うためにsmbus2をインストールします。smbus2パッケージは「smbus2-0.3.0」でした。
sudo pip install smbus22.8インチTFT液晶ライブラリ
2.8インチTFT液晶 (240×320)モジュールの液晶コントローラLSIはILI9341。Adafruitのライブラリ「Adafruit_CircuitPython_RGB_Display」を利用させていただきました。
sudo pip install adafruit-circuitpython-rgb-displayhttps://github.com/adafruit/Adafruit_CircuitPython_RGB_Display
SCD30ライブラリ
SCD30のライブラリには「scd30_i2c」を利用させていただきました。ライブラリ「scd30_i2c」のバージョンは「scd30-i2c-0.0.6」でした。利用には、Pythonバージョン >=3.7.3が必要です。
sudo pip install scd30-i2chttps://pypi.org/project/scd30-i2c/
BME280ライブラリ
BME280のライブラリには「RPi.bme280 0.2.4」を利用させていただきました。Python3コード上でI2Cアドレスとポート番号を指定できるで使い勝手が良いです。
sudo pip install RPi.bme280https://pypi.org/project/RPi.bme280/
Python3:BME280、SCD30測定データを2.8インチTFT液晶に表示するプログラムコード
Adafruitライブラリ付属のサンプルプログラム「rgb_display_pillow_stats.py」を参考にして、SCD30センサでCO2濃度、BME280センサで気圧、気温、湿度の測定結果の出力先として2.8インチTFT液晶を加えたプログラムコード「bme280_scd30_sample_TFT_csv.py」を作りました。
日本語を表示するために、独立行政法人情報処理推進機構 (IPA) が提供している日本語フォント「IPAex フォント」をインストール。「ipaexfont-gothic」を使っています。
sudo apt install fonts-ipaexfontRaspberry Pi OS with desktop(bullseye)にプリインストール されているThonny Python IDEを使って動作確認しました。
Thonny Python IDEのshell部分にCSV形式で連続表示するとともに、2.8インチTFT液晶にも2秒間隔で表示します。
CSV表示は、先頭から日時(曜日)、SCD30データ(CO2濃度、気温、湿度)、BME280データ(気圧、気温、湿度)。2.8インチTFT液晶表示は、上からBME280データ(気温)、SCD30データ(CO2濃度)、BME280データ(気圧、湿度)、日時(曜日)です。
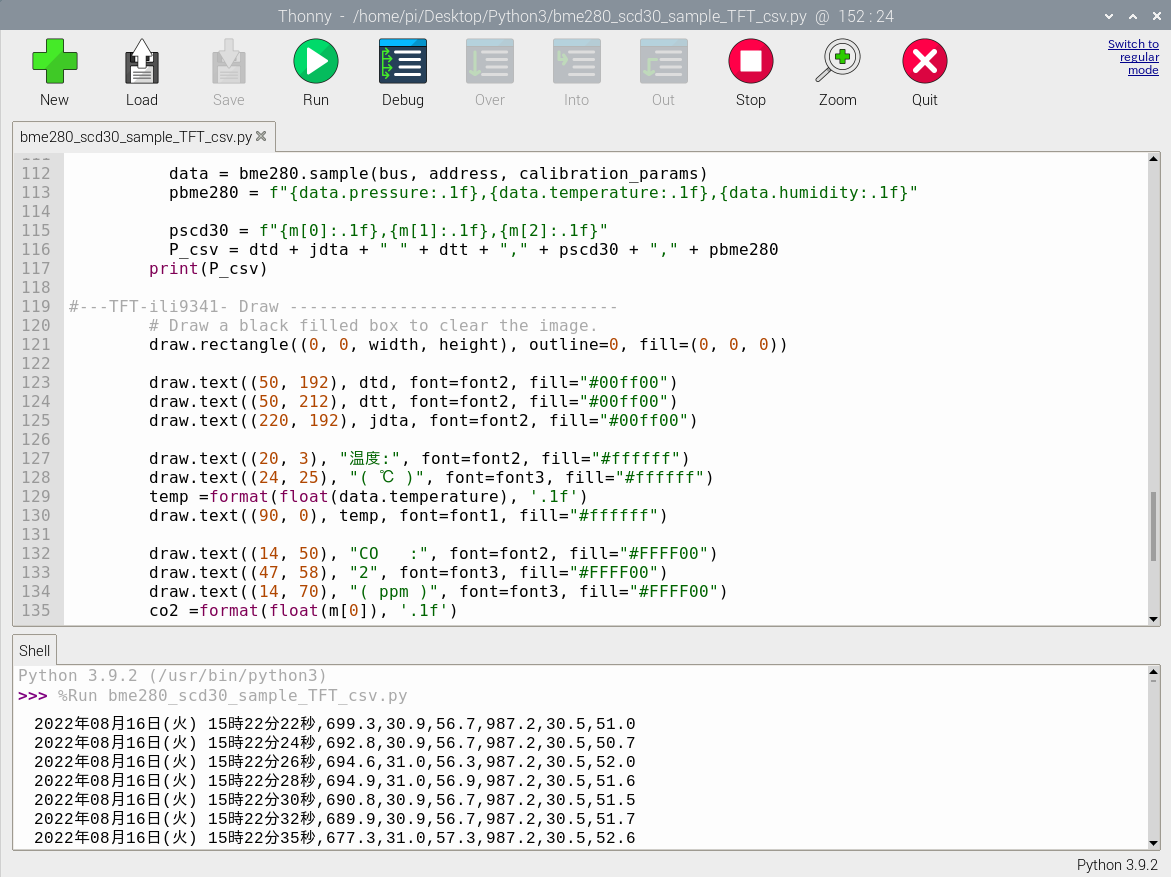
Thonny Python IDEのshell部分へのCSV表示が不要な場合は117行目を#でコメントアウトします。
bme280_scd30_sample_TFT_csv.py
※ここをクリックするとコード表示を開閉できます。
#bme280_scd30_sample_TFT_csv.py
#coding: utf-8

#---TFT-ili9341 init-----rgb_display_pillow_stats.py---
import time
import subprocess
import digitalio
import board
from PIL import Image, ImageDraw, ImageFont
from adafruit_rgb_display import ili9341

# Configuration for CS and DC pins (these are PiTFT defaults):
cs_pin = digitalio.DigitalInOut(board.CE0)
dc_pin = digitalio.DigitalInOut(board.D25)
reset_pin = digitalio.DigitalInOut(board.D24)

# Config for display baudrate (default max is 24mhz):
BAUDRATE = 24000000

# Setup SPI bus using hardware SPI:
spi = board.SPI()

# pylint: disable=line-too-long
# Create the display:
disp = ili9341.ILI9341(
    spi,
    rotation=90,  # 2.2", 2.4", 2.8", 3.2" ILI9341
    cs=cs_pin,
    dc=dc_pin,
    rst=reset_pin,
    baudrate=BAUDRATE,
)
# pylint: enable=line-too-long
# Create blank image for drawing.
# Make sure to create image with mode 'RGB' for full color.
if disp.rotation % 180 == 90:
    height = disp.width  # we swap height/width to rotate it to landscape!
    width = disp.height
else:
    width = disp.width  # we swap height/width to rotate it to landscape!
    height = disp.height

image = Image.new("RGB", (width, height))

# Get drawing object to draw on image.
draw = ImageDraw.Draw(image)

# Draw a black filled box to clear the image.
draw.rectangle((0, 0, width, height), outline=0, fill=(0, 0, 0))
disp.image(image)

# First define some constants to allow easy positioning of text.
padding = -2
x = 0

# Load a ipaexfont-gothic font.
font1 = ImageFont.truetype("/usr/share/fonts/opentype/ipaexfont-gothic/ipaexg.ttf", 50)
font2 = ImageFont.truetype("/usr/share/fonts/opentype/ipaexfont-gothic/ipaexg.ttf", 20)
font3 = ImageFont.truetype("/usr/share/fonts/opentype/ipaexfont-gothic/ipaexg.ttf", 15)


#---BME280 init---------------bme280_sample.py------------
import smbus2
import bme280

port = 1
address = 0x76
bus = smbus2.SMBus(port)

calibration_params = bme280.load_calibration_params(bus, address)

# the sample method will take a single reading and return a
# compensated_reading object
data = bme280.sample(bus, address, calibration_params)


#---SCD30 init-----------------scd30_sample.py------------
from scd30_i2c import SCD30

scd30 = SCD30()

scd30.set_measurement_interval(2)
scd30.start_periodic_measurement()

time.sleep(2)

while True:
#---csv out  ------------------------------------------
    if scd30.get_data_ready():
        m = scd30.read_measurement()
        if m is not None:
          dtd = time.strftime('%Y年%m月%d日', time.localtime())
          dtt = time.strftime('%H時%M分%S秒', time.localtime())
          dta = time.strftime('%a', time.localtime())
          if dta == "Mon":
           jdta = dta.replace("Mon", "(月)")
          elif dta == "Tue":
           jdta = dta.replace("Tue", "(火)")
          elif dta == "Wed":
           jdta = dta.replace("Wed", "(水)")
          elif dta == "Thu":
           jdta = dta.replace("Thu", "(木)")
          elif dta == "Fri":
           jdta = dta.replace("Fri", "(金)")
          elif dta == "Sat":
           jdta = dta.replace("Sat", "(土)")
          elif dta == "Sun":
           jdta = dta.replace("Sun", "(日)")
          else:
           jdta="ー"

          data = bme280.sample(bus, address, calibration_params)
          pbme280 = f"{data.pressure:.1f},{data.temperature:.1f},{data.humidity:.1f}"

          pscd30 = f"{m[0]:.1f},{m[1]:.1f},{m[2]:.1f}"
          P_csv = dtd + jdta + " " + dtt + "," + pscd30 + "," + pbme280
        print(P_csv)

#---TFT-ili9341- Draw ---------------------------------
        # Draw a black filled box to clear the image.
        draw.rectangle((0, 0, width, height), outline=0, fill=(0, 0, 0))

        draw.text((50, 192), dtd, font=font2, fill="#00ff00")
        draw.text((50, 212), dtt, font=font2, fill="#00ff00")
        draw.text((220, 192), jdta, font=font2, fill="#00ff00")

        draw.text((20, 3), "温度:", font=font2, fill="#ffffff")
        draw.text((24, 25), "( ℃ )", font=font3, fill="#ffffff")
        temp =format(float(data.temperature), '.1f')
        draw.text((90, 0), temp, font=font1, fill="#ffffff")

        draw.text((14, 50), "CO   :", font=font2, fill="#FFFF00")
        draw.text((47, 58), "2", font=font3, fill="#FFFF00")
        draw.text((14, 70), "( ppm )", font=font3, fill="#FFFF00")
        co2 =format(float(m[0]), '.1f')
        draw.text((90, 47), co2, font=font1, fill="#FFFF00")

        draw.text((20, 97), "気圧:", font=font2, fill="#ffffff")
        draw.text((18, 117), "( hpa )", font=font3, fill="#ffffff")
        pres =format(float(data.pressure), '.1f')
        draw.text((90, 93), pres, font=font1, fill="#ffffff")

        draw.text((20, 143), "湿度:", font=font2, fill="#ffffff")
        draw.text((24, 165), "( % )", font=font3, fill="#ffffff")
        humi =format(float(data.humidity), '.1f')
        draw.text((90, 140), humi, font=font1, fill="#ffffff")

        disp.image(image)

        time.sleep(2)
    else:
        time.sleep(0.2)
SCD30センサのセルフキャリブレーション
SCD30センサは換気の良い場所で電源を入れたままで一定時間連続測定してセルフキャリブレーションします。400ppm台の数値に落ち着くと思います。
SparkFun SCD30 CO₂ センサー ライブラリ
注: SCD30 には、自動セルフキャリブレーション ルーチンがあります。Sensirion は、セルフキャリブレーションを完了するために、少なくとも 1 日 1 時間の「新鮮な空気」で 7 日間の連続測定を推奨しています。Note: The SCD30 has an automatic self-calibration routine. Sensirion recommends 7 days of continuous readings with at least 1 hour a day of ‘fresh air’ for self-calibration to complete.
https://github.com/sparkfun/SparkFun_SCD30_Arduino_Library
Interface Description Sensirion SCD30 Sensor Module p.13/21
1.4.6 自動セルフキャリブレーション (ASC) の (非) アクティブ化
継続的な自動セルフキャリブレーションは、次のコマンドで (非) アクティブにすることができます。 初めてアクティブ化する場合、アルゴリズムが ASC の初期パラメーター セットを見つけることができるように、最低 7 日間必要です。 センサーは、毎日少なくとも 1 時間は新鮮な空気にさらす必要があります。 また、その間、センサーを電源から切り離すことはできません。そうしないと、キャリブレーション パラメータを見つける手順が中止され、最初からやり直す必要があります。 正常に計算されたパラメータは SCD30 の不揮発性メモリに保存され、再起動後も以前に見つかった ASC のパラメータが引き続き存在するという効果があります。1.4.6 (De-)Activate Automatic Self-Calibration (ASC)
https://sensirion.com/media/documents/D7CEEF4A/6165372F/Sensirion_CO2_Sensors_SCD30_Interface_Description.pdf
Continuous automatic self-calibration can be (de-)activated with the following command. When activated for the first time a period of minimum 7 days is needed so that the algorithm can find its initial parameter set for ASC. The sensor has to be exposed to fresh air for at least 1 hour every day. Also during that period, the sensor may not be disconnected from the power supply, otherwise the procedure to find calibration parameters is aborted and has to be restarted from the beginning. The successfully calculated parameters are stored in non-volatile memory of the SCD30 having the effect that after a restart the previously found parameters for ASC are still present.